

An Autopsy of the 2024-25 Winnipeg Jets: The Team
A postmortem analysis of the Winnipeg Jets season and learning from mistakes

It’s been a roller coaster month for Winnipeg Jets fans, after barely scraping by the St. Louis Blues only to fall to the Dallas Stars in six.
We’ve taken some time to move through the stages of grief, and now it’s time to conduct an autopsy on the entire team and analyze everything that comes with it.
We’ll look at both regular season and post-season performance, team strengths and weaknesses. In our next post, we’ll take a peek at pending free agents, their contract projections, and whether or not they are worth it.
My posting schedule will be a bit irregular for the off-season, but I hope to keep some regular content going for everyone, along with exclusive content for premium-tier subscribers.
Regular Season Team Performance
The Winnipeg Jets won the President’s Trophy, which is theoretically a slightly stronger signal of team ability than the more desirable Stanley Cup. Tore Purdy projected that the NHL’s best team on average would win the President’s Trophy theoretically about 32% of the time, but only the Stanley Cup about 22% of the time.
That doesn’t mean there’s no “luck” in the regular season or no “skill” in the playoffs—just that the ratios are marginally different.
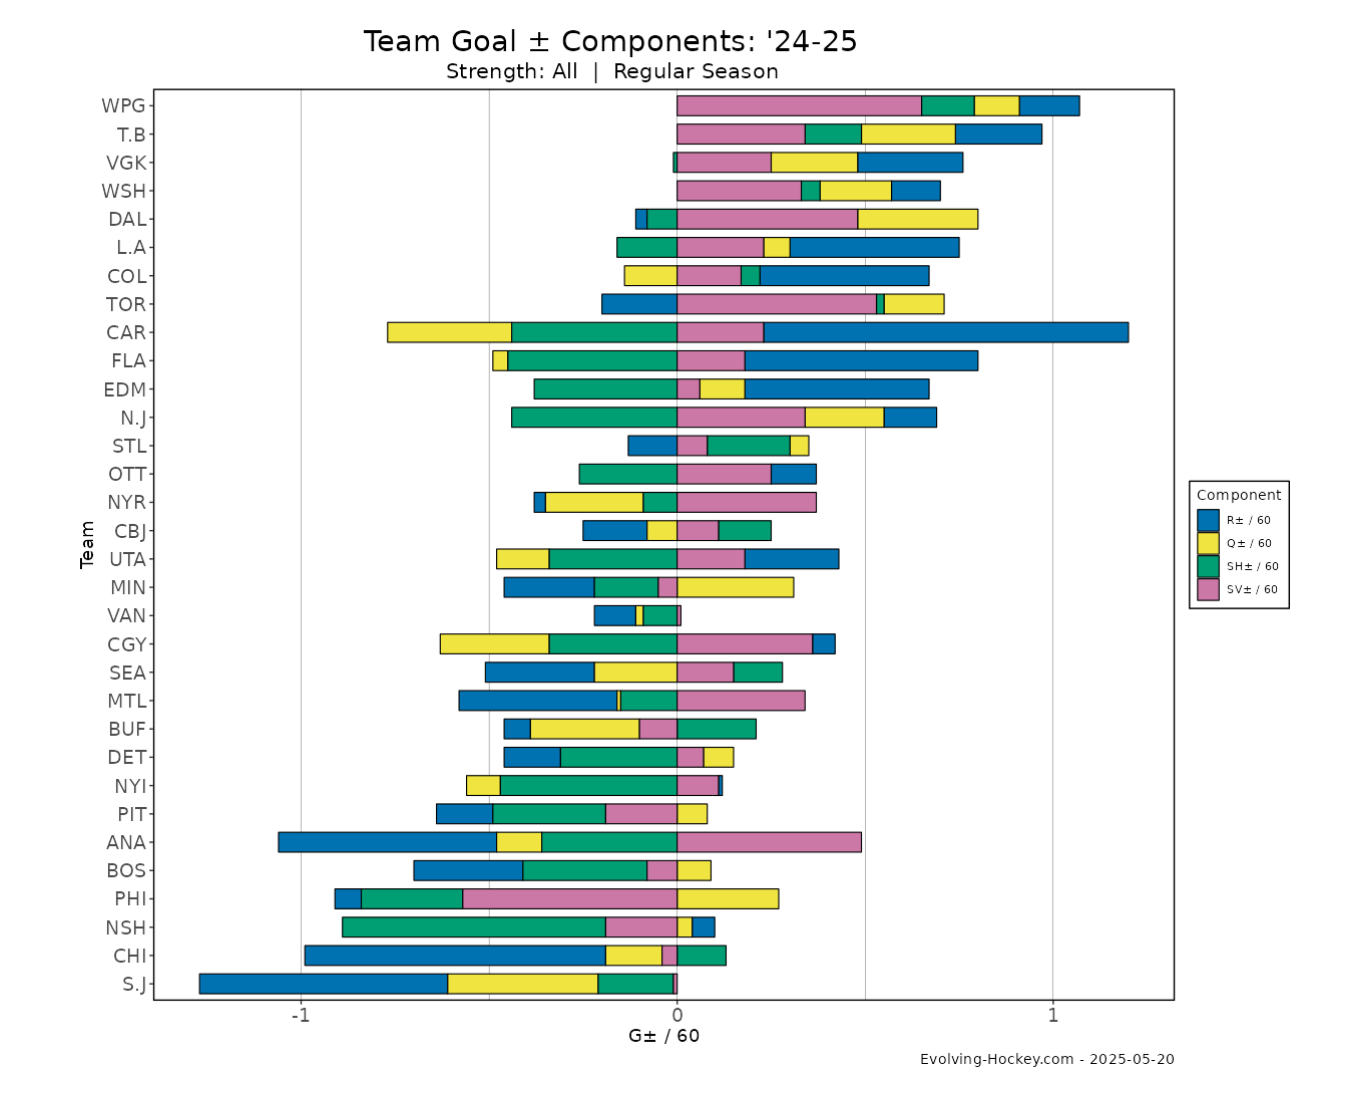
The Jets had the best goal differential with +86. Evolving-Hockey.com further shows how the Jets were above average in all four key factors:
Hockey analytics at its most basic form is simply a numerical (or visual) representation of what happens on the ice, with measurable scale. They aren’t some theoretical or metaphysical construct that exists only in our minds.
Teams want to score more goals than their opponents, and they do so by impacting four factors:
Create more chances than their opponents: shot volume, shot rates, Corsi, etc. (blue above)
Make your chances better than your opponents': shot quality, expected goals, etc. (yellow above)
Capitalize on your chances: finishing, shooting, setting, etc. (green above)
Prevent your opponents from capitalizing on their chances: goaltending, saving, etc. (pink above)
The visual shows how the Jets were the best team at outscoring their opposition. It also shows that they were above average in all factors, but were driven primarily by goaltending.
The Jets were good enough to be in the playoff mix, but it was goaltending that made them special.
Again, this isn’t to say they stunk elsewhere. The Jets were 9th in the league in shot quantity and 9th in shot quality—which oddly makes them 12th in shot quantity and quality combined—and 4th in finishing.
We’ll discuss this more later, but is it really surprising that a team ranking between 4th and 12th in most factors finished in the second round—essentially placing them 5th to 8th in the tournament—when goaltending didn't hold up?
Let’s break this down further by looking at how shot quantity and quality performance looks specifically at 5v5 and on special teams, using visuals from HockeyViz.com:
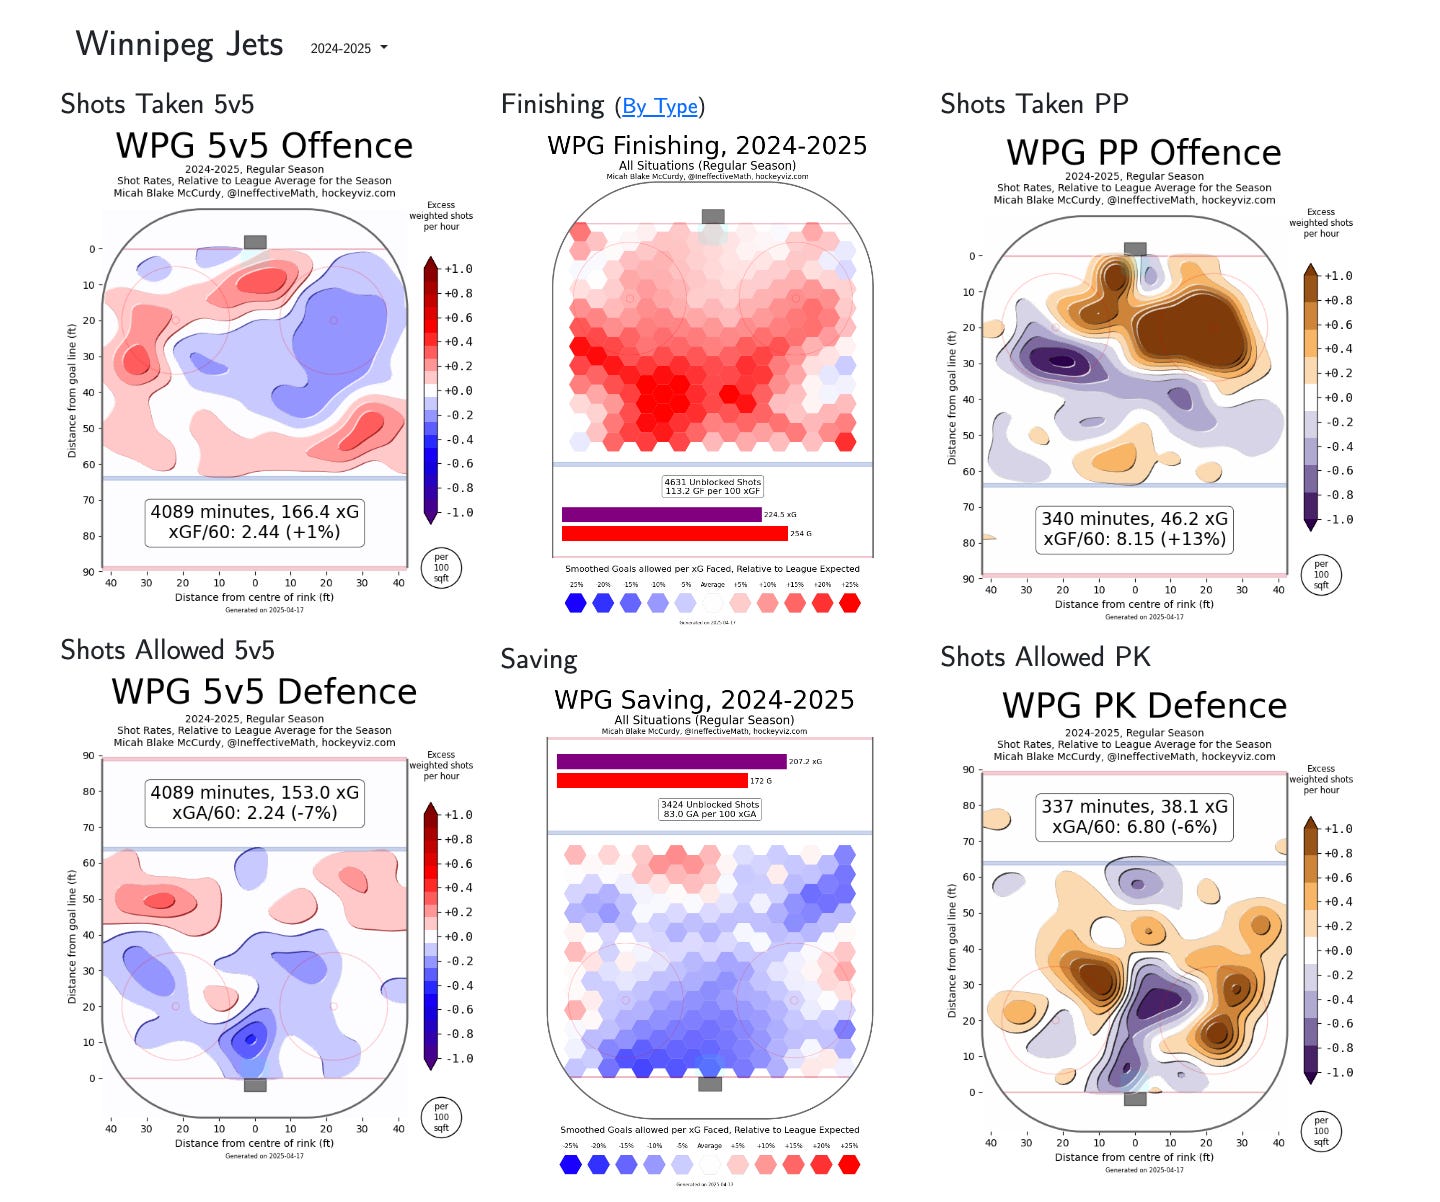
Moving from top-left to bottom-right:
The Jets were essentially average at creating chances at 5v5.
They were elite at finishing their chances in both 5v5 and special teams.
They were very good at creating chances on the power play.
They were fairly solid at preventing chances at 5v5.
Their goaltending was elite.
Their penalty kill (which stunk for most of the year) moved to fairly solid by season’s end.
The Jets were not a below-average team outside of goaltending, but goaltending was what shifted them from great to true contenders. That’s fine—except when goaltending fails you.
There’s a reason why people hesitate to jump on the bandwagon for teams driven by goaltending, even with a netminder as good and consistent (in the regular season) as Connor Hellebuyck.
In my one and only article for The Athletic back in 2017, I wrote about how different components drive points in the standings.

In an individual game, shot volume is much less important than shot quality, finishing, and goaltending. However, those things are more volatile and fleeting. A good outshooting team will get outshot less often than a good goaltending team will lose the goalie battle. Most of the “luck” portion is volatility from those shot quality, finishing, and goaltending factors.
Of course, “good” and “bad” are relative terms. What’s average in the regular season is no longer average in the playoffs, once the bottom half of the league is gone.
The graphic below (same six areas as the HockeyViz visual) shows how the Jets looked compared to their two playoff opponents and how Stanley Cup contenders tend to look:
The Jets were good enough to contend. They were better than the average Stanley Cup winner (and their opponents) in pretty much every area except one: 5v5 offense chance generation.
Unfortunately, that’s the strongest signal of the six for playoff success. If the Jets had won the Cup, they would have been the third-worst team in that area going back as far as 2007. Only one below-league-average team has ever won: the Washington Capitals.
It was also the only area where Dallas had a sizeable advantage over Winnipeg.
So, in summary: the Jets were a good team—good enough to win a round or two depending on goaltending. But the area they were weakest in is also the most important one not to be weak in.
The Roster
A quick aside on value models:
The graphic above shows each player’s percentile performance in weighted GAR relative to the league. Weighted GAR combines components of GAR and xGAR, though the weighting differs depending on whether we’re looking at EV offense, EV defense, etc.
Evolving-Hockey’s GAR and xGAR are descriptive value models, focusing on how much value a team got from a player relative to a replacement-level skater. GAR uses boxscore stats (goals, assists, blocks, hits, etc.), while xGAR is based on RAPM expected goal +/- plus finishing and goaltending adjustments.
These models aren’t focused on predictive power. While descriptive and predictive values are related, they are not the same.
Extreme example: A butt goal has high descriptive value, but not much predictive value. Still, some predictive value exists, because you had to be in a good situation for that goal to occur.
HockeyViz’s sG model is predictive. It estimates what value a player would give their team if every NHL player had the exact same archetype usage (ice time, special teams, etc.).
Descriptive models look better on optimally deployed players. Predictive models should, in theory, reflect the same value regardless of usage.
Forwards

A quick cursory look at the Jets’ roster suggests there was a lot more line optimization available than what coach Scott Arniel deployed.
The top line had a much better season this year, although most of that value comes from being part of the league’s best power play. At 5v5, they were fairly average for a top line—which is a legitimate problem for a contending team, though masked in surface-level analysis.
Still, average is a big improvement over last season’s version of the same trio. But “scoring the most 5v5 goals” isn’t that impressive when you have 23% more ice time than the second-most deployed line.
In the middle-six, the cracks appear:
The Jets never had a true second line.
Their middle-six units were highly specialized, useful at home but vulnerable without last change.
Vlad Namestnikov is not a top-six forward. He’s excellent as a fourth-line center and decent as a third-line center.
Cole Perfetti is a quality second-line forward, but would thrive best as the third-best skater on a line.
Adam Lowry is passable as a 2C with the right wingers—but Appleton and Niederreiter aren’t those wingers, especially the latter.
The Jets had depth—a strength before the trade deadline—until they traded for a player who hurt their depth and made them worse.
They went from having arguably the best 4th line in the NHL to a liability.
A best-case deadline would have added a 2C, which was a known need. Failing that, it would have been better to stand pat, shuffle middle-six centers, lean more on Lowry’s line, and swap Appleton for Iafallo.

sG is not as kind to the Jets' best forwards (except Ehlers), but is a bit nicer to their depth forwards.
It suggests:
Ehlers is elite, and highly underutilized by the team.
The top-line forwards get their value from lots of high-quality minutes despite being only slightly above average.
Lowry is highly valuable, almost exclusively defensively.
Iafallo is a better fit than Appleton as a shutdown partner with Lowry.
Trading for Brandon Tanev—and playing him over David Gustafsson—was a mistake.
Defenders & Goaltending

The strength of the Jets’ top two left-shot defenders—Josh Morrissey and Dylan Samberg—is no secret.
One excels offensively, the other defensively. Together, they are an elite core to build around.
But the surrounding cast? sG shows how poor that looks for the Jets.

Colin Miller and Dylan DeMelo are good enough skaters.
Neal Pionk works—but mostly when stapled to Samberg.
All three are right-shot defenders, so you want only one in your top four. That’s not the case here.
Then there’s the baffling usage:
The best of the three (Miller) was often benched in favor of Luke Schenn, who actively made the team worse.
Miller had nearly equal descriptive value as DeMelo and Pionk with half the minutes.
Schenn made the Jets slower, worse in transition, worse at defending, worse at generating offense, and his “grit” didn’t stop the Blues from injuring Jets players.
Even Logan Stanley, while not good, wasn’t far behind the worst defenders—if you ignore his bottom-10 penalty differential.
Then there’s Connor Hellebuyck.

Connor Hellebuyck was the best goalie in the NHL and arguably the best player in the regular season.
Then came the playoffs… and the wheels fell off.
He was rough early but was improving by the end—too little, too late.
What was interesting is that the Jets had only one “Goalie Loss” game, which is when the goalie plays poorly, and the Jets would have won if they only had average goaltending. In other words, the Jets skaters were outplayed by their opponent in all but one loss, which means while Hellebuyck was really, really bad… the Jets skaters were bad in their losses too.
The Playoffs
Note: Weighted shots = Corsi where goals are regressed toward xG. More aggressive regression for goals against than goals for.
Unfortunately, we don’t have the same depth of models available for the playoffs as we do for the regular season. There’s no adjusting for context, environment, or usage. All we can really do is show how the Jets performed with a given skater on the ice and make some inferences about who the drivers and passengers were.
For example, I’d suggest that Appleton’s numbers were mostly carried by Lowry, and Iafallo may have been sunk by struggling linemates like Tanev and Barron.
Regardless, there were too many skaters playing too poorly for us to be confident in this team—even with better goaltending.
I still can’t believe the Winnipeg Jets thought dressing Schenn (or Stanley, or Fleury) over Miller was a good idea. Just terrible decision-making.
You can also clearly see how PDO impacts perception. Take Fleury’s “performance” in the playoffs: he was the most outshot and outchanced defender on the Jets, but since more goals went in for the Jets than against while he was on the ice, everyone feels like he had a great series.
I get that people want to like Fleury because he’s not Logan Stanley. But Stanley actually outperformed Fleury in both weighted GAR during the regular season and weighted shot metrics in the playoffs—though not in expected goals (sG).
That’s not what I want from someone I’m hoping is an upgrade. There are likely better options available.
We’ll look more closely at the Jets’ pending free agents, roster, prospects, and decision points next week.
If you're enjoying the content and want to dive deeper into the numbers—including manually tracked microstatistics—consider upgrading to premium. I make it as cheap as Substack allows to ensure you get maximum value.
Microstatistics
I tracked the Jets’ performance in zone entries, zone exits, and a few other areas throughout the year and playoffs. Let’s take a look!
Keep reading with a 7-day free trial
Subscribe to The Five Hohl to keep reading this post and get 7 days of free access to the full post archives.