
Mastering Evolving-Hockey Pt 3: GAR, xGAR, WAR, xWAR, etc.
Mastering Evolving-Hockey Pt 3: GAR, xGAR, WAR, xWAR, etc.
Continuing Our Hockey Analytics Overview and Information Series

Oh hi!

Welcome once again to The Five Hohl, where we normally look at hockey analytics with a heavy Winnipeg Jets tilt… normally but today we ignore my hometown and continue going over the Evolving-Hockey.com website.
Quick Update With Garret
Not much to report on. Just out here trying to live the good life.
I’ve been reading Antifragile by Nassim Taleb, the fourth book in the Incerto series. I really enjoyed Fooled by Randomness quite a bit many years ago, but I find each subsequent book in the series to be more of a mixed bag, at least for me. Still, I always get something out of each one, even if it’s just a different perspective on something I disagree with.
Speaking of which, I talked to an NHL amateur scout yesterday about asymmetric probabilities, black swans, and similar concepts. I want to touch on these topics at some point, but not quite yet.
Trending Winnipeg Jets Topics
This section will be on hold unless there is major, topical news to discuss. This will allow more time and space for the larger Analytics Overview Series.
Analytics Overview Series: Parsing Through Evolving-Hockey.com (Part 3)
GAR PAGES
GAR PLAYER TABLES
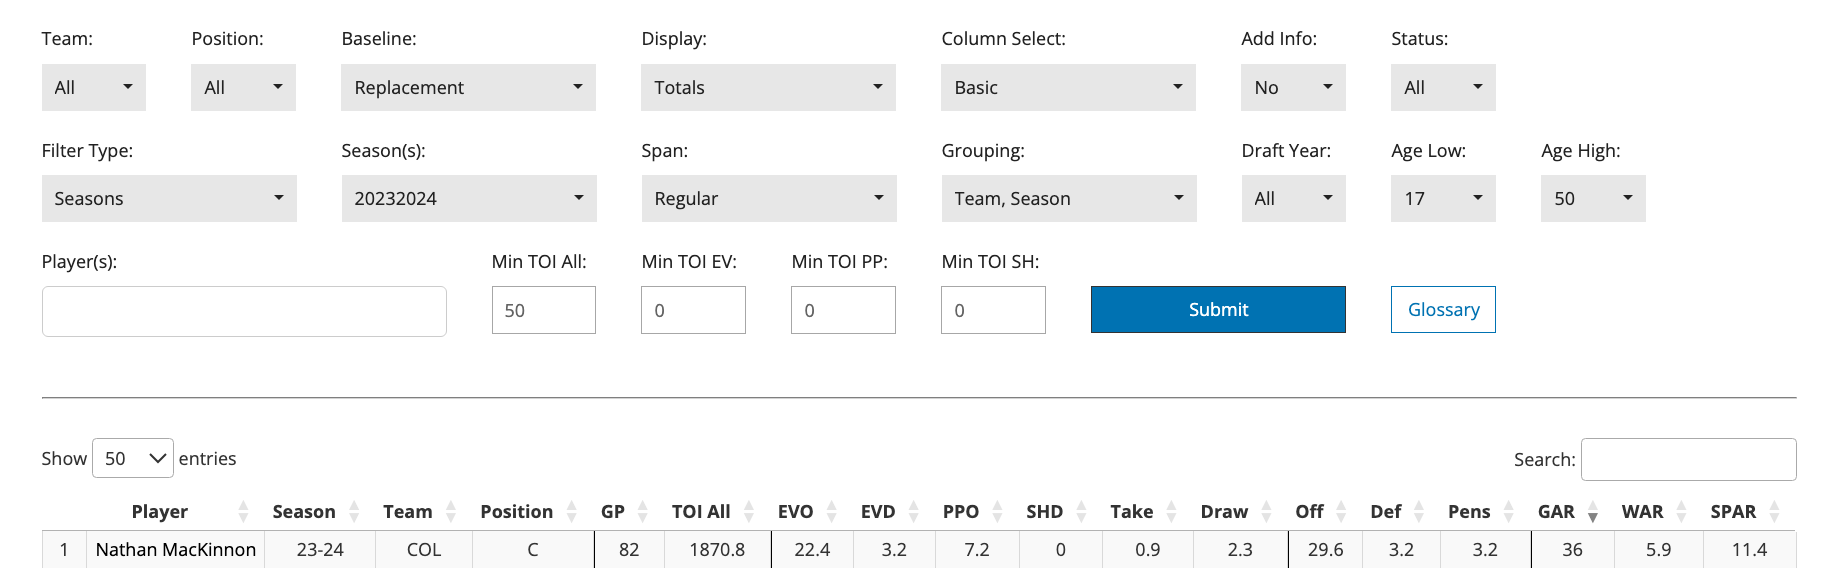
The GAR player table’s filters function similarly to the regular player statistics tables but focus on Goals Above Replacement (GAR) for different categories.
What is GAR?
Goals Above Replacement (GAR) is a single-number statistic that estimates a player’s overall contribution to the team. A GAR of 0 represents a baseline, or easily replaceable, player.
There are many GAR or WAR (Wins Above Replacement) models out there, each attempting to quantify value, though they may differ greatly in how they describe it. Evolving-Hockey’s GAR model emphasizes description rather than prediction of value.
We touched on this earlier, but here’s a quick, extreme example to illustrate the difference:
Suppose you’re playing a beer league game, and the puck ricochets off your rear and into the net. Descriptively, you’ve contributed a lot of value by scoring the goal. Predictively, though, it’s unlikely that you’ll generate much value in future games because that goal was a fluke.
Evolving-Hockey’s Version
As noted, Evolving-Hockey.com’s GAR model is designed to estimate the descriptive value a player generates for their team.
I won’t go in details to the design, but you can read their three part series on that here. However, here’s a quick gist from their write up:
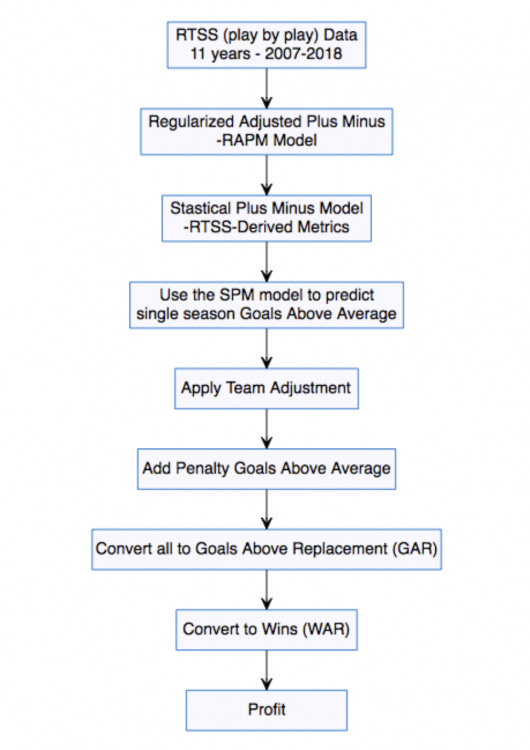
In simple terms, they built a Boxscore Plus-Minus model, similar to The Athletic’s Game Score model, trained to correlate with their historical long-term RAPM results.
Multiple regression models were used to link various stats (e.g., relative to teammate goals for, goals scored, shots taken, hits, blocks) to RAPM goal differential outputs in different situations (5v5, 5v4, etc.). This ensemble of models is then weighted to Goals Above Average and adjusted for penalty differentials, which is then converted to replacement level.
This process differs from Dawson Sprigings’ WAR model, which combines a BPM and RAPM model to generate its results.
Why WAR?
What is it good for? Quite a lot, actually.
WAR converts every statistic to one common currency (goals, wins, or standings points), allowing comparisons of a player’s importance across different metrics. Goal scoring, blocks, hits, etc. are all weighted as important as they are in relating to outscoring the opposition.
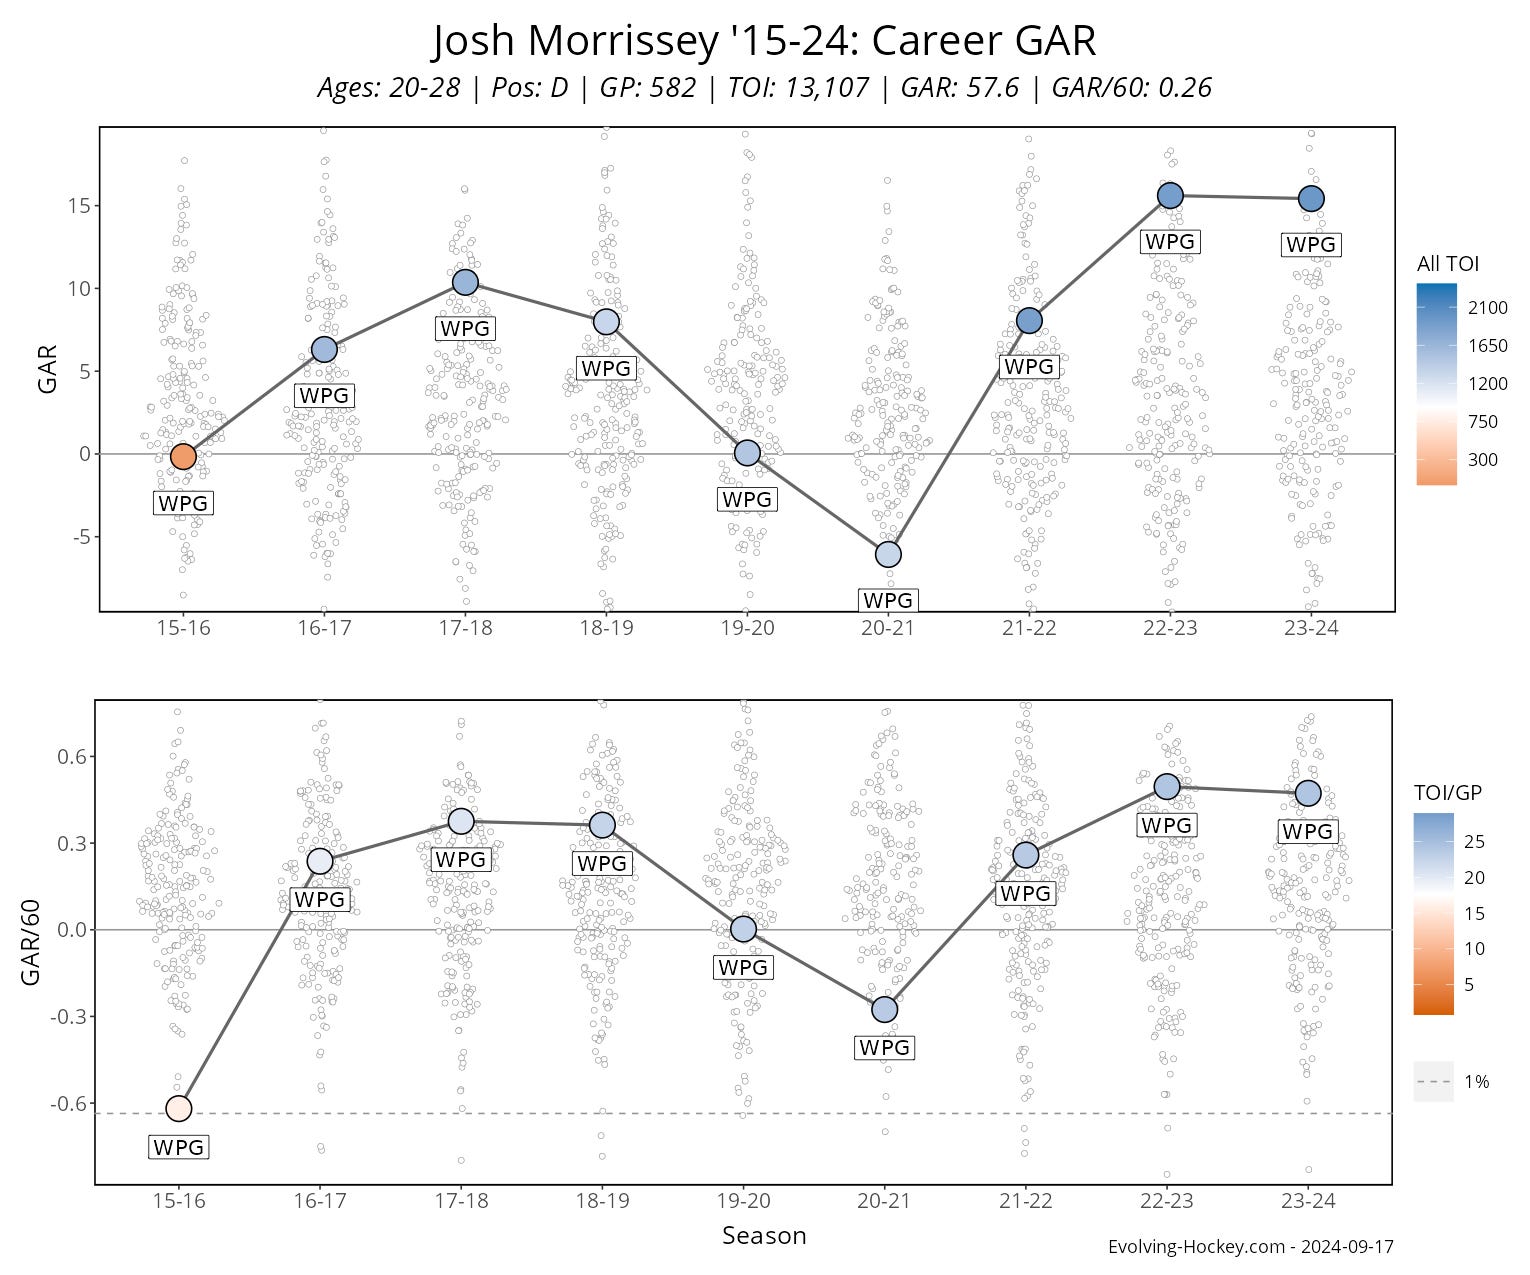
The downside is that combining multiple factors introduces uncertainty. For example, I’m confident that Josh Morrissey’s +15.4 GAR last season is much better than Logan Stanley’s -1.1, but less certain that Kyle Connor’s +1.5 is significantly better than Axel Jonsson-Fjällby’s +0.7.
xGAR PLAYER TABLES
The xGAR tables are the same as the GAR tables, except all the column headings (except for penalties) have an “x” in front, signifying expected.
While it may seem to some that the xGAR model would focus on predicting future value, it is still descriptive, just heavily depends on expected goals.
Evolving-Hockey’s xGAR
Evolving-Hockey’s xGAR is similar to earlier WAR models from Corsica and WAR-on-Ice. It starts with xGoal RAPM results, but then adjusting each shot for shooter talent and goaltender talent.
While xGAR incorporates more factors that influence whether goals are scored or prevented, it’s still not designed specifically to predict future performance (unlike HockeyViz.com’s sG model for contrast).
One Note: As mentioned, xGAR tables do not have an “x” in front of TAKE, DRAW, or PEN. This is because the GAR and xGAR models use the same values for penalties.
Weighted GAR
Long-time readers will remember my use of wGAR (Weighted GAR). Weighted GAR takes the average of each GAR and xGAR component (e.g., Even Strength Offense) and combines them.
I determined these weightings by comparing GAR/60 and xGAR/60 from one year multiplied by year-two ice time, taking the sum of these values to create a team value, and comparing it to team performance in goal differential.
This makes wGAR more predictive than either GAR or xGAR model individually.
GAR GOALTENDER TABLES
Lastly, we have goaltender GAR, which is part of the xGAR process.
One of the creators explained to me:
It is the opposite side of the skater shooting value model used in our xGAR model (basically, skater shooting value is the offense and goalie saving value is the defense).
This means two things:
Goalie GAR should be compared to player xGAR, not GAR, for accurate comparisons.
Since there’s a shooter talent component in goaltender GAR, it should be considered superior to the simpler Goals Saved Above Expected (GSAx) model. GSAx only looks at how many goals a goalie saves above expectations.
GAR CHARTS
GAR/xGAR Charts

The chart above ranks all players by GAR (Goals Above Replacement) from highest to lowest for the selected timeframe, breaking down each component of their total GAR. For example, we can see that Kyle Connor excels offensively, but his weak defense lowers his overall impact. Similarly, Neal Pionk shows strong offensive contributions, but his poor defensive performance outweighs the benefits.
You can filter the chart by team, year, and minimum ice time.
There's also a percentile version of this chart, allowing you to see which players are most similar in overall impact.
GAR - Career
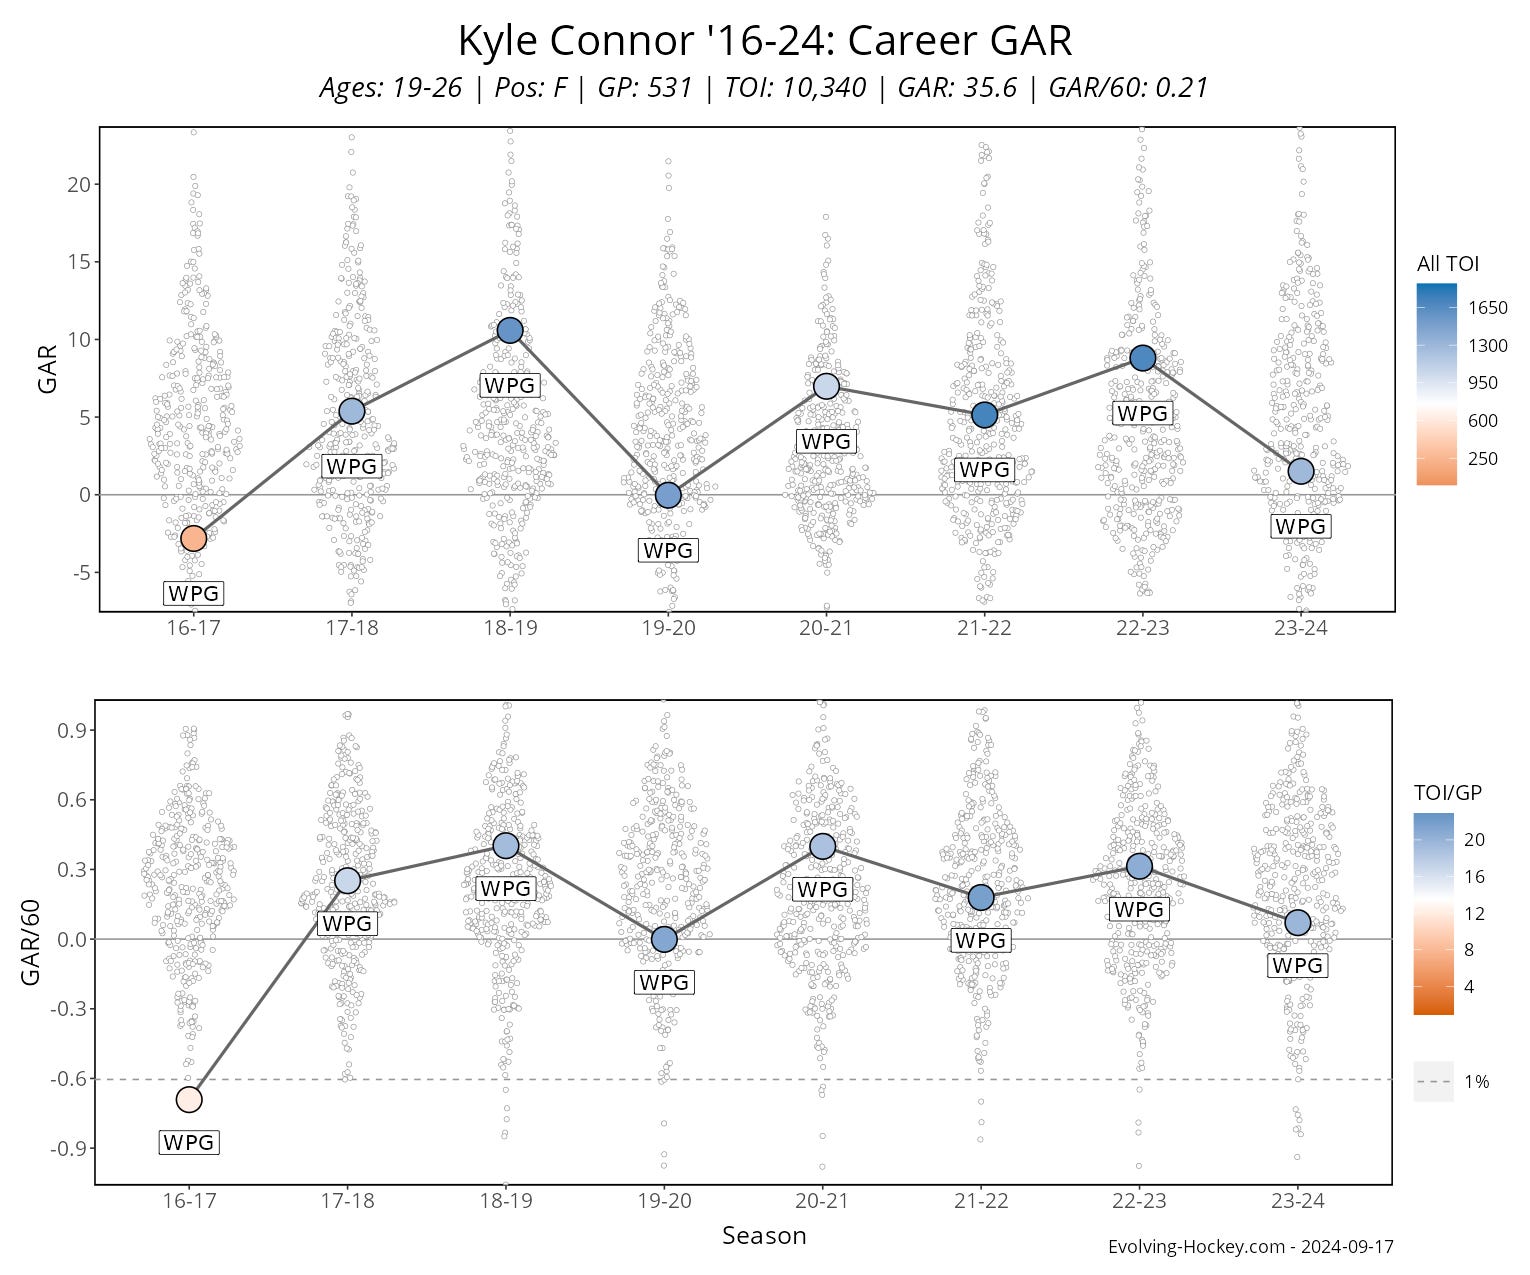
This visualization shows a player’s GAR (or xGAR) performance throughout their career. The color coding indicates ice time, helping provide context and infer confidence intervals. Additionally, it includes a population distribution for forwards or defensemen, giving scale to their performance.
These career graphs are useful for several reasons:
They help identify outlier seasons, such as Kyle Connor's 2019-20, which may have been affected by bad luck or injury.
They reveal players whose value may be inflated by heavy ice time, like Connor, whose GAR is often higher than it would be based on his ice time alone. This suggests that he may be overutilized by the coaching staff.
They can indicate trends in a player's development, though predicting these trends can be tricky, as I’ve learned from a past mistake in 2021:
PLAYER CARDS
Confession: part of why I started this series was to explain player cards to people on Twitter and Reddit who didn’t understand them.
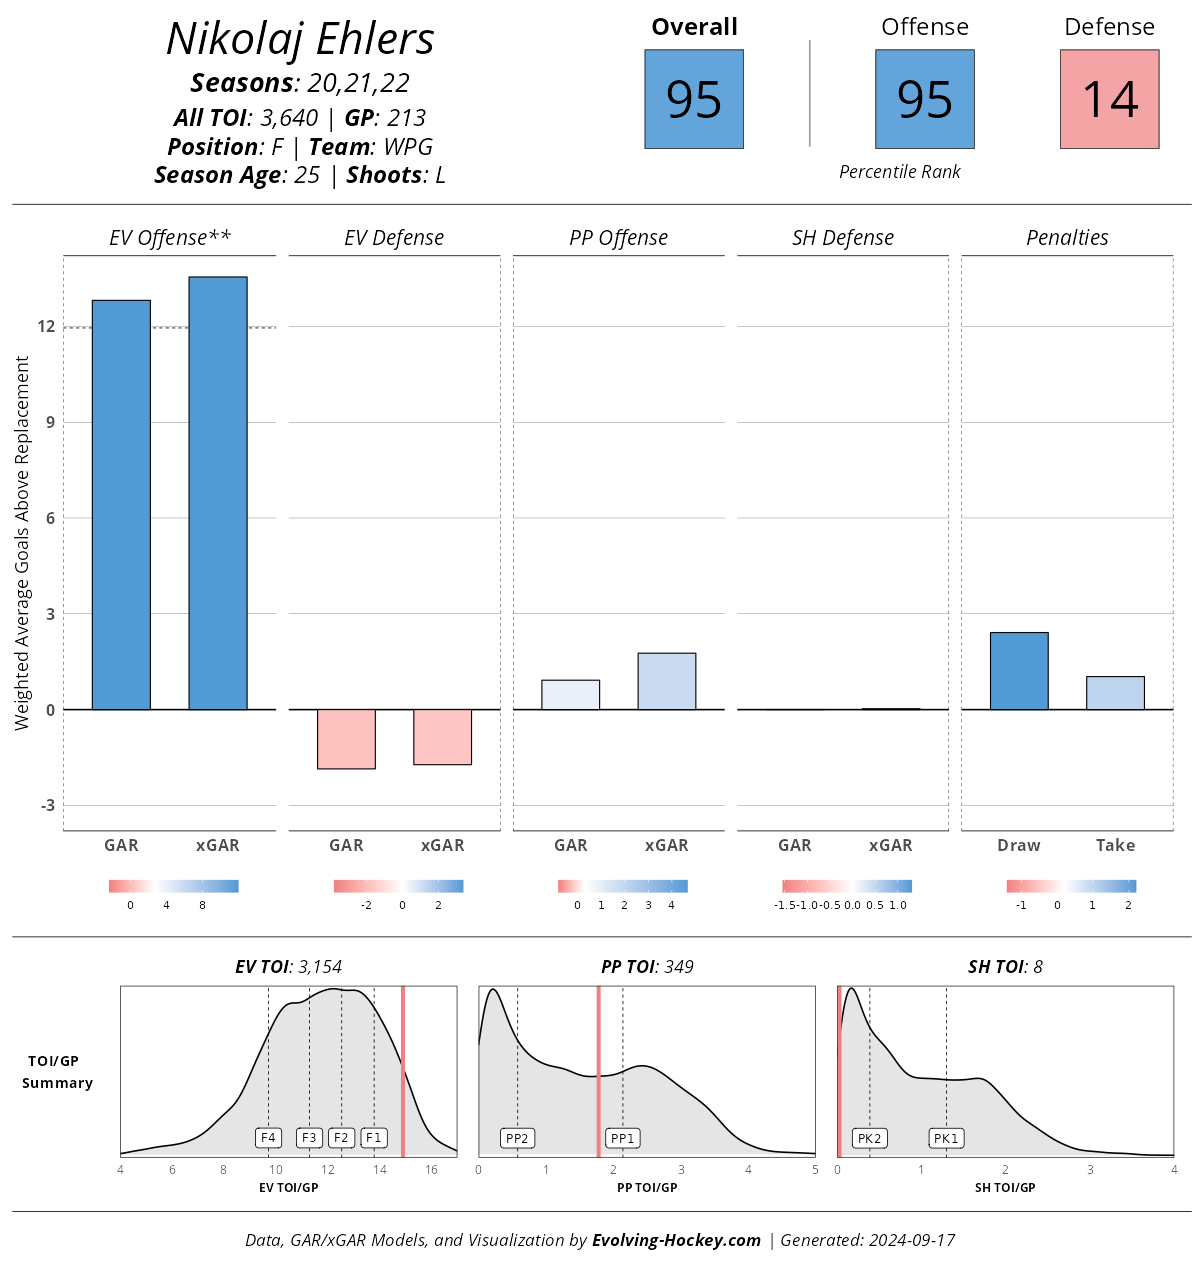
Player cards provide an overall snapshot of a player’s performance relative to their peers.
In the top left corner, you'll find basic player info, such as age, ice time, and games played.
The top right corner offers a quick summary of the player’s value in percentiles. For example, Ehlers being in the 95th percentile means he provided more value than 95% of forwards over that timeframe. The chart breaks this into offensive and defensive components.
The bar graphs display the individual elements, showing both GAR and xGAR values. The overall values in the top right use Evolving-Hockey’s weighted GAR model, which differs from my own.
What’s interesting is how the bar heights show absolute values, while the bar colors represent relative values. Ehlers is elite in even strength offense and penalty drawing, but the absolute value of his offense is about four times larger than his penalty drawing.
At the bottom, we see deployment relative to the league. Ehlers has significant 5v5 usage, but less power play time than most 95th percentile forwards, and he’s rarely used on the penalty kill.
Quick Note on Distributions

Most player cards show performance in percentiles because they are more intuitive for people, especially those familiar with video games. Knowing Nathan MacKinnon had +36 GAR last season doesn’t convey as much as saying he was in the 100th percentile.
However, this comes with the downside of performance scaling. The gap between the 100th and 99th percentiles is much larger than between players ranked in the middle.
For instance, MacKinnon had +36 GAR, but dropping just 25 spots to 26th place, Matt Boldy had only +18 GAR—a 50% drop, with the league median around +2 GAR.
So, remember that big percentile changes near the middle often mean less than small changes at the extremes.
GOALIE CHARTS

These charts are the closest thing we have to goalie player cards.
The left chart represents even strength performance, while the right shows shorthanded performance. The bar heights represent Z-scores (standard deviations), which function similarly to percentiles.
Each graph includes:
Team performance, with the expected save percentage for an average goalie based on the shot quality of unblocked shots (Fenwick).
The actual Fenwick save percentage for the goalie.
dFSv% (delta Fenwick save percentage), showing the difference between actual and expected performance. AKA: shot quality adjusted goalie performance.
The goalie’s xGAR per unblocked shot attempt, which adjusts dFSv% for shooting talent. AKA: shot quality and shooter talent adjusted goalie performance.
This data shows that Hellebuyck performed much better at even strength than on the penalty kill last season, though he was still above average on the penalty kill, dragged down somewhat by team play.
Series Thus Far
Closing Thoughts
Next week, I’ll do a case study on a player, incorporating everything we've covered from Evolving-Hockey. I’m considering Cole Perfetti, but feel free to suggest someone else. That will wrap up our Evolving-Hockey overview, and we’ll move on to another website.
Thank you for reading this summer format, which will continue through September until the regular season starts. Regular structured posts will return on October 14th.
If you’d like to support my work at The Five Hohl, please consider liking, sharing, and subscribing. For even more support, join the paid tier for an additional weekly post during the season and other perks. I hope to provide even more value to paid subscribers in the coming years.