What Does Regression to the Mean Actually Mean
We look at the Winnipeg Jets microstatistics, and answer other analytical questions surrounding the team

Welcome to this week's edition of our regular Wednesday content—or Friday… wait a second.
Typically, Wednesdays are reserved exclusively for paid-subscriber hockey analysis, where we explore the intricate world of hockey statistics, analytical theory, player development, and, of course, the Winnipeg Jets.
This week, however, I’ll be placing the microstats section at the end of Friday’s (today’s) post, behind a paywall. Additionally, I’m skipping the mailbag this week, as I have quite a bit I want to share.
I’ll return to the usual content schedule next week.
Let’s dive straight in…
REGRESSION TO THE MEAN AND WHAT DOES IT MEAN
Each season, fans and pundits label a few teams as overperformers or underperformers, bringing up the concept of regression to the mean.
In this post, I’ll delve into a bit of hockey’s analytical history and explore what this might mean for the Jets.
LUCK IN HOCKEY
Hockey is a game of weighted probabilities. Nothing is guaranteed; every team struggles to win, and only some succeed in overcoming their opponents.
But how do we define luck?
One way was shown by Gabriel Desjardins (a former Winnipeger), who estimated how much luck is in the standings.
Imagine a lockout where NHL owners, eager to maintain revenue, decide to simulate the season using completely fair 50/50 coin tosses. Even with no skill involved and every game determined by chance, one team would still win the President’s Trophy, while another would finish at the bottom.
By comparing these hypothetical distributions to actual NHL standings, we can estimate how much of the variation comes from luck versus skill:
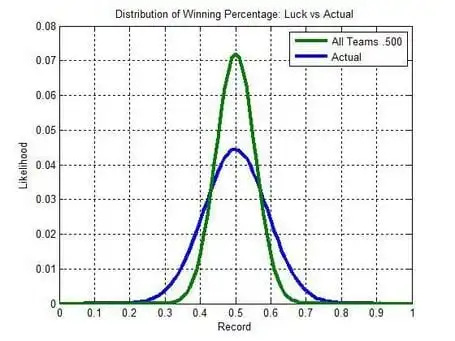
This method suggests that about 38% of the differences in team standings result purely from luck.
Josh Weissbock (formerly of the Florida Panthers and now consulting with Columbus Blue Jackets) used machine learning and calculated an eerily similar 37.6% came from pure luck.
The better or more deserving team doesn’t always win. Sometimes, the best team loses—and they might lose more often than expected. Probabilistically, this means multiple potential outcomes exist for any given matchup.
Torre Purdy, a foundational blogger in hockey analytics that left us far too soon, calculated that theoretically the NHL’s best and most deserving team wins the President’s Trophy only 33% of the time, that’s just one-third! They should win the Stanley Cup 22% of the time, just under one-quarter.
Even more astonishingly, Purdy found that the best team theoretically misses the playoffs entirely about 2.2% of the time. While that’s just once every 45 years or so, it’s still a mind-blowing concept.
HOCKEY METRICS AND PREDICTIVE MEASURES
This is part of why we focus on underlying metrics. Winning is the ultimate goal, but even over large samples—like an 82-game season—wins alone don’t perfectly reflect a team’s or player’s true talent.
When it comes to players, the situation is even more complex. Even if a player performs consistently with their true talent level, it’s difficult to determine whether the team won because of their contributions or despite them. This holds true even for players with significant ice time or those in key positions.
Underlying metrics aren’t just arbitrary numbers; they measure the actual performance of a team in the critical areas needed to impose their will and achieve victory:
Shot Quantity (Corsi, Fenwick, etc.): Creating more chances than the opponent.
Shot Quality (Expected Goals per Shot): Ensuring your chances are better than theirs.
Finishing/Setting/Goaltending: Capitalizing on opportunities effectively.
Understanding how and why a team won or lost provides valuable insight into whether those outcomes are sustainable.
Because of this, underlying metrics often predict future performance more accurately than past wins or goal differentials.
Torre Purdy discovered with Corsi long ago:

This principle applies not only to teams but also to individual players.
Just over a decade ago, I (yes, as in me) showed that the vast majority of players who over or underperform their Corsi% in goals, do not the following year:
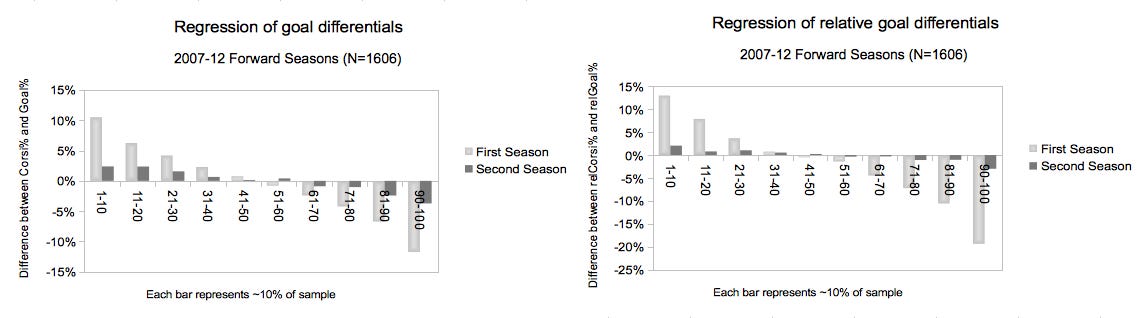
It’s worth noting that regression isn’t completely to the league mean. Players who outperformed in the past still tend to outperform, but by much smaller margins—about 80% less than before, on average.
Note: While not directly related to our topic, the figures above aren’t isolated performance like with RAPM. They are raw data, and part of the sustained 20% effect in over/underperformance can be attributed to players remaining in similar team environments, linemate quality, roles, and with comparable goaltending year over year.
REGRESSION TO THE MEAN
Gabriel Desjardin calculated that PDO after the first 1000 shots regresses by about 87% for the remainder of the season:
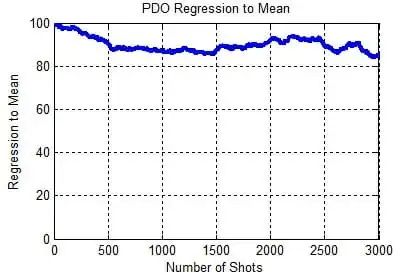
For example, a team with a PDO of 1030 (e.g., a 0.920 save percentage and an 11% shooting percentage) in their first 1,000 shots would, on average, have a PDO of about 1004 for the rest of the season (e.g., a 0.915 save percentage and an 8.9% shooting percentage).
Regression to the mean doesn’t imply that bad luck predicts future good luck or that good luck predicts future bad luck.
Instead, it simply means that we expect some teams and players often outperform their underlying metrics randomly. Knowing who has done so in the past provides little insight into who will continue to do so in the future because of that noise.
SO, NOW TO THE JETS
The Winnipeg Jets are currently second in the standings after spending much of the season in first.
A large part of their success comes from banking points early in the season. The team had a historic 15-1-0 run but has been a more average 16-13-3 since then. That’s a 56.2-point percentage, placing them between the Ottawa Senators and Calgary Flames, tied for 15th in points pace.
This isn’t to say that Winnipeg is bad or that 16-13-3 reflects the “real” Jets.
The 15-1-0 run was just as much a part of the team’s story. Both stretches contribute to the full picture of what defines this team. The question is where in the middle is this team?
The metrics we use are meaningful because they provide the performance in fundamentals that help drag out the signal from the noise.
GOALS, EXPECTED GOALS, AND CORSI… and Weighted Shots
When isolating for most environmental factors (e.g., RAPM or isolated shots), these metrics reveal distinct layers. To add to the earlier discussion:
Corsi: Represents shot volume talent and some luck/noise.
Expected Goals: Builds on Corsi by factoring in shot quality and more luck/noise.
Goals: Adds finishing, setting, and goaltending talent to expected goals with, yes, even more luck/noise.
Interestingly, despite being the simplest metric—focused solely on shot quantity—Corsi consistently predicts team and player success better than expected goals or goals.
Corsi provides a clearer picture of whether a player or team is under- or overperforming compared to metrics that include additional variables.
HOWEVER…
This doesn’t mean the other two metrics lack value. Goals and expected goals still offer meaningful insights into a team’s performance, even if they’re more influenced by noise and false signals.
This is why a metric like weighted shots, frequently used here by me, is effective. At its core, weighted shots is essentially Corsi with an added layer of goals and expected goals data.
The main limitation of weighted shots is that the numerical values don’t directly represent physical events like shots or goals, or conceptual probabilities like expected goals.
Goals and expected goals remain important because they convey valuable information. However, it’s essential to approach them critically since the noise to signal ratio is extremely high even in very, very large samples.
Be skeptical of anyone dismissing the insights from Corsi simply because goals or expected goals metrics suggest a different narrative that matches their own opinion. Shot volume, as measured by Corsi, often provides the most reliable foundation for analyzing team and player performance.
Corsi alone is not optimal, but it’s superior to the other basic metrics.
It’s interesting that the Jets rank 14th here, especially when their 16-13-3 point percentage would place them 15th.
Again, this doesn’t necessarily mean the Jets’ true talent level is only at that ranking, but it’s further evidence that the team may need more help than their overall record suggests.
They have solid goaltending. They have an elite power play. Yet, there are still gaps—particularly in their 5v5 play—that need addressing if they want to maximize their playoff chances. Especially since 5v5 performance (especially offense) is the strongest signal of future playoff success.
Of course, some argue that NHL teams have access to significantly more data than the public, which is true on a surface level. But that perception is often overstated.
Take SportsLogiq, the largest private data provider for NHL teams. They recently released a snapshot of team 5v5 expected goal numbers via TSN, and guess where the Jets ranked—14th.
To be clear, private data is far, far more granular and in-depth than the public data available through the NHL’s play-by-play files. This information has the potential to provide marginal advantages teams crave, but it’s primary value is it can be incredibly effective for strategic and coaching purposes.
However, that doesn’t mean every team—or even most teams—are fully leveraging this data.
Consider how public data is used: there’s a wide range in the quality of analysis, even among those using the same metrics or models. The same applies to those using private data—having access to it doesn’t automatically mean it’s being used optimally.
For fun, here are the weighted shots results for the Jets’ most commonly used lines and pairings:


Is it weird that most of the Jets’ defensive combinations are negative while most of the forward lines are positive? Kind of…
NOTE: I WAS (most likely) WRONG
Recently, I made quite a fuss on Twitter and Bluesky about a quote from Jets’ head coach Scott Arniel regarding Logan Stanley playing on his off-hand side.
Arniel mentioned liking Stanley on his off-hand side last year, which surprised me because I couldn’t recall Stanley being in that position. Stanley, by most meaningful metrics, isn’t particularly strong, and playing a defenseman on their off-hand side usually hinders performance further.
Offhand (pun intended), I thought to myself: Surely, I’d remember if Stanley had played extensively on his off-hand side.
I started looking into it. Stanley’s most common left-handed partners were Nate Schmidt and Dylan Samberg.
Schmidt: He’s long preferred playing on the right side—so much so that he actively dislikes playing his natural left side. That ruled him out, in my mind.
Samberg: I wasn’t as certain about him. I knew he played on the right side with Ville Heinola in the AHL and was fairly confident he’d also done so during the playoffs.
So, I reviewed a few games where Stanley and Samberg were paired, using my tracking sheets where I note team lines and pairings before each game. My sheets showed that Samberg was listed as playing on the right side.
What I didn’t do was check all the games they played together.
Winnipeg Free Press columnist Mike McIntyre pointed out that the official team lineups and PR from the Jets showed different assignments at various points in the season. To verify, I used an older play-by-play event locations model (tracking shot and hit positions) to predict who played on which side.
Sure enough, the model’s results aligned with McIntyre’s findings and the Jets’ official listings for most of the regular season. Oddly, my tracking sheets and the event locations model disagreed with the Jets’ listings during the playoffs, where I’m still almost certain Samberg was on the right side.
All of this is a long-winded way of saying:
I’m sorry, I was wrong.
Everyone’s memory sucks.
This is why we should rely on data more—it keeps us honest.
MICROSTATISTICS SEASON UPDATE
Keep reading with a 7-day free trial
Subscribe to The Five Hohl to keep reading this post and get 7 days of free access to the full post archives.